


Salesforce Reporting is one of the most powerful features, used to give users many different views into their data, and for Admins to demonstrate the value Salesforce has upon the organization’s productivity.
Building reports in the Lightning Report Builder, a drag and drop interface, is extremely effective – as a Salesforce Admin, you should have a solid idea of all the options available to you when reporting requirements come up.
What are advanced reporting features in Salesforce? These are the tricks Salesforce power-users should know to ultimately create the reports users need – even with challenging data models – in the most efficient and scalable way (with minimal additional configuration).
Let’s have a look at some of the more advanced reporting options that Salesforce offers.
1. Custom Report Types
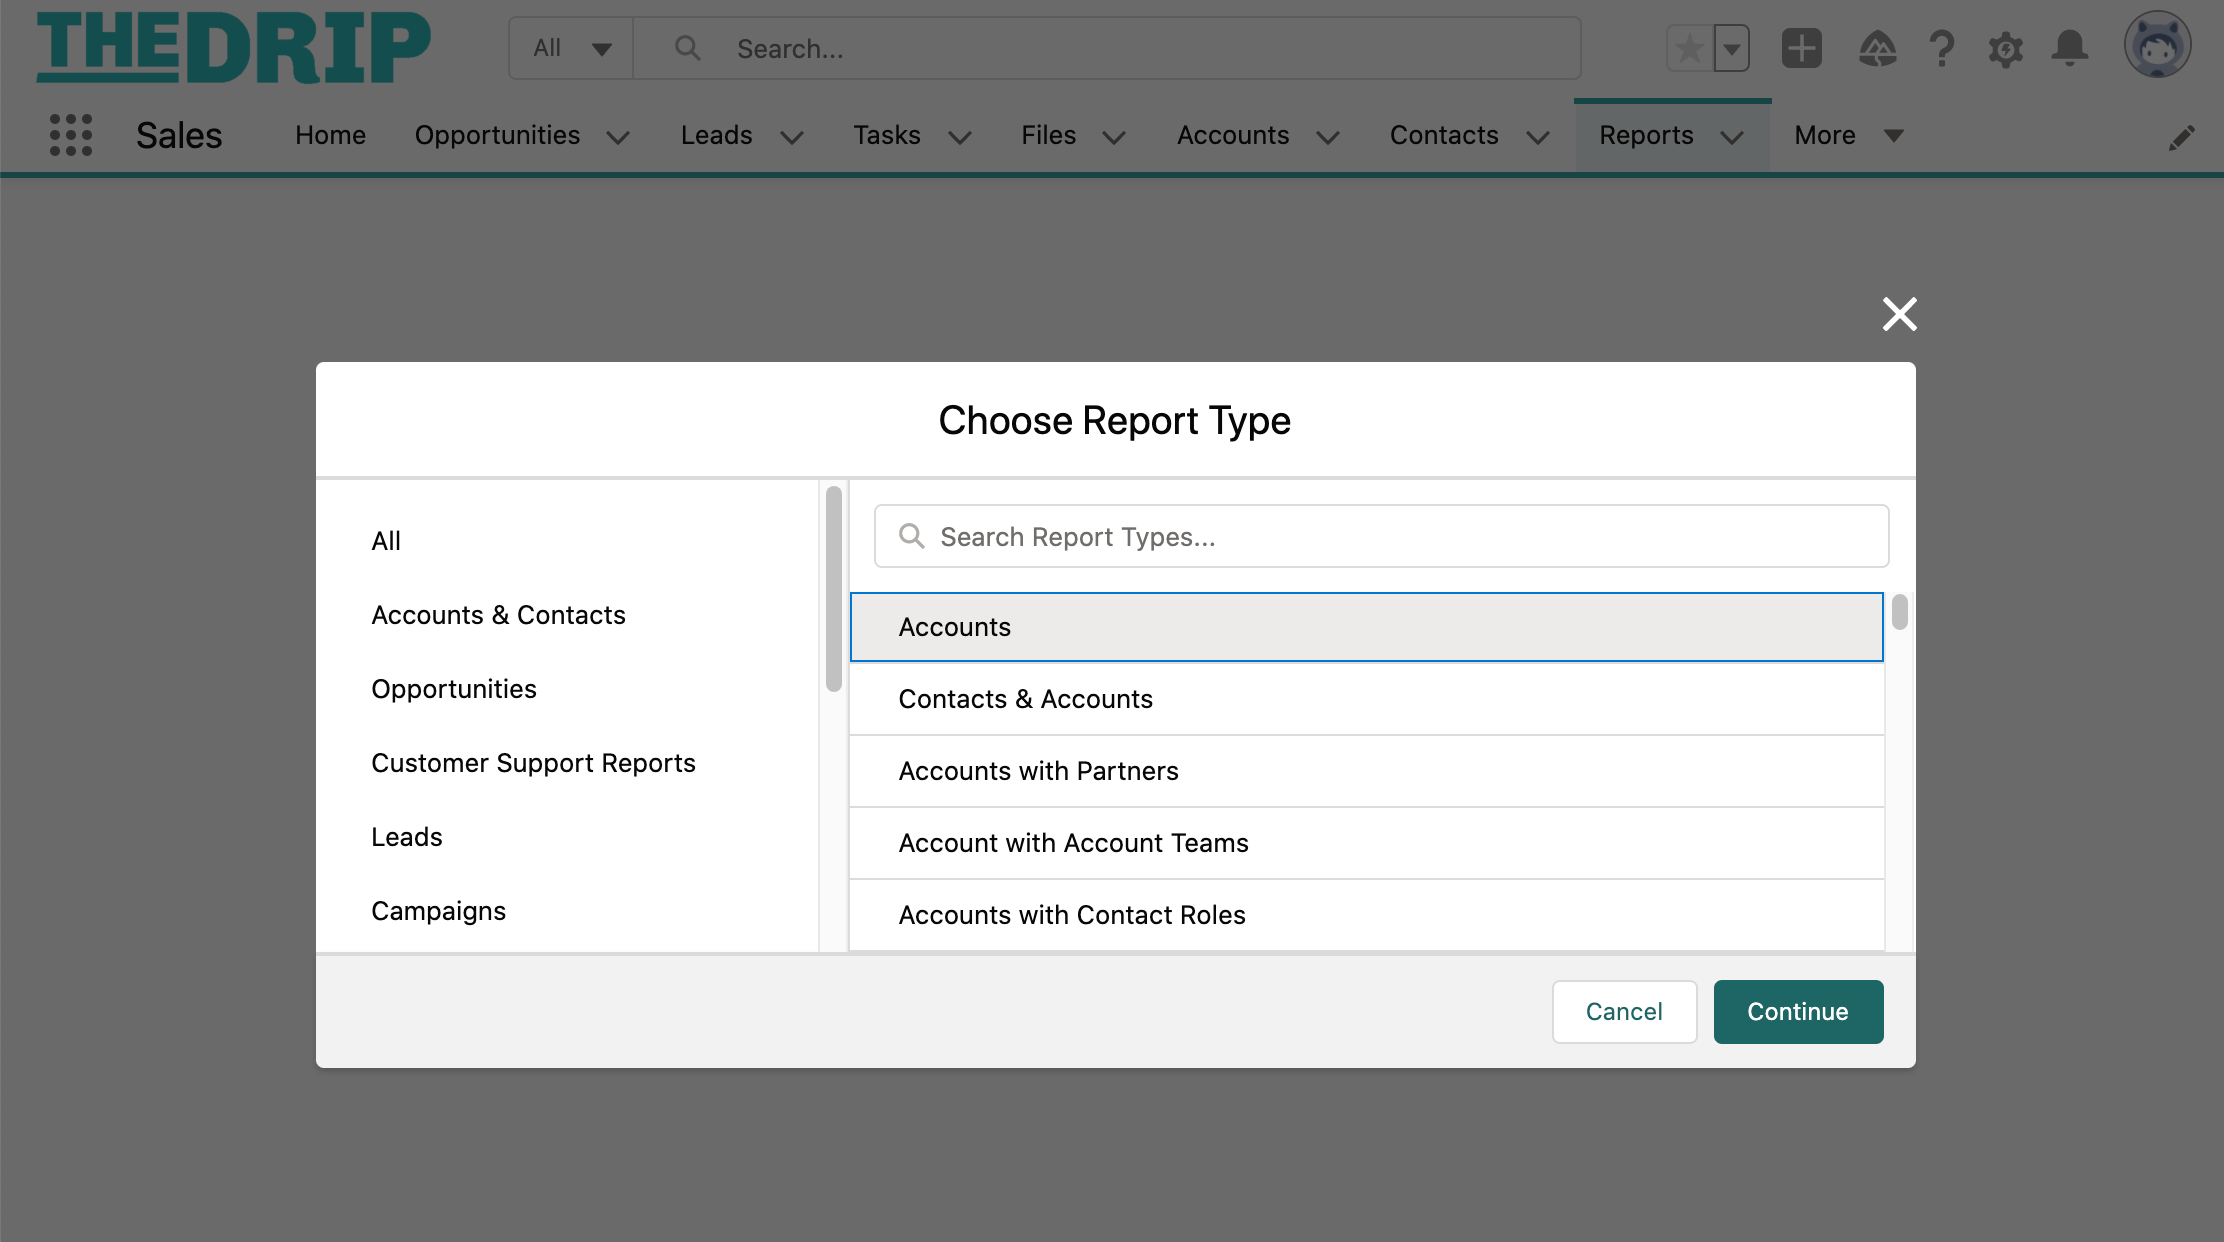
Salesforce comes with report types out-of-the-box for all standard objects and standard object relationships eg. “Contacts & Accounts” or “Opportunities with Products”. You can view a list of report types when creating a new report:
For the custom objects we build, Salesforce also creates report types automatically.
These report types have a “with” or “and” relationship, depending on whether the two objects have a Lookup or Master-detail relationship.
You may want to go beyond standard and auto-created report types, when you need to report:
- On more than two objects at a time,
- On “without” relationships (not just “with”)
This is where Custom Report Types come in.

The high-level steps to create a custom report type are:
1. Select the objects you would like to include.
2. Depending on the Primary object (Account in the example above), the wizard will show you its child objects. You can also report on grandchild objects, up to a total of 4 objects.
3. You will notice that we can specify whether the object selected has to have related records to show up in the report. This is useful if you would like to show a report, eg. Accounts with & without Opportunities.
Bonus! You can now auto-add fields to Custom Report Types, without having to manually add new fields that you create to each report type.
2. Cross Filters (Exception Reports)
When filtering reports, sometimes you want to retrieve records with or without other related records – such as, to identify Accounts without executive Contacts, or Opportunities without any Activities in the past week.
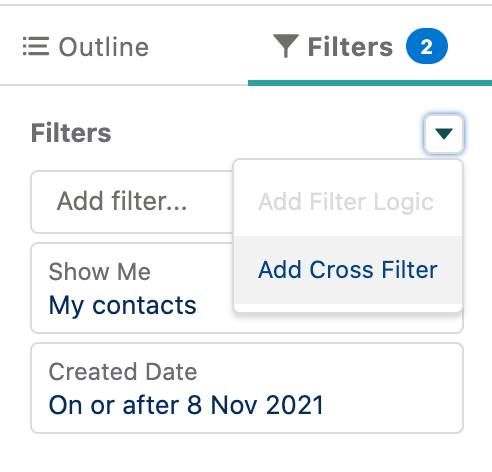
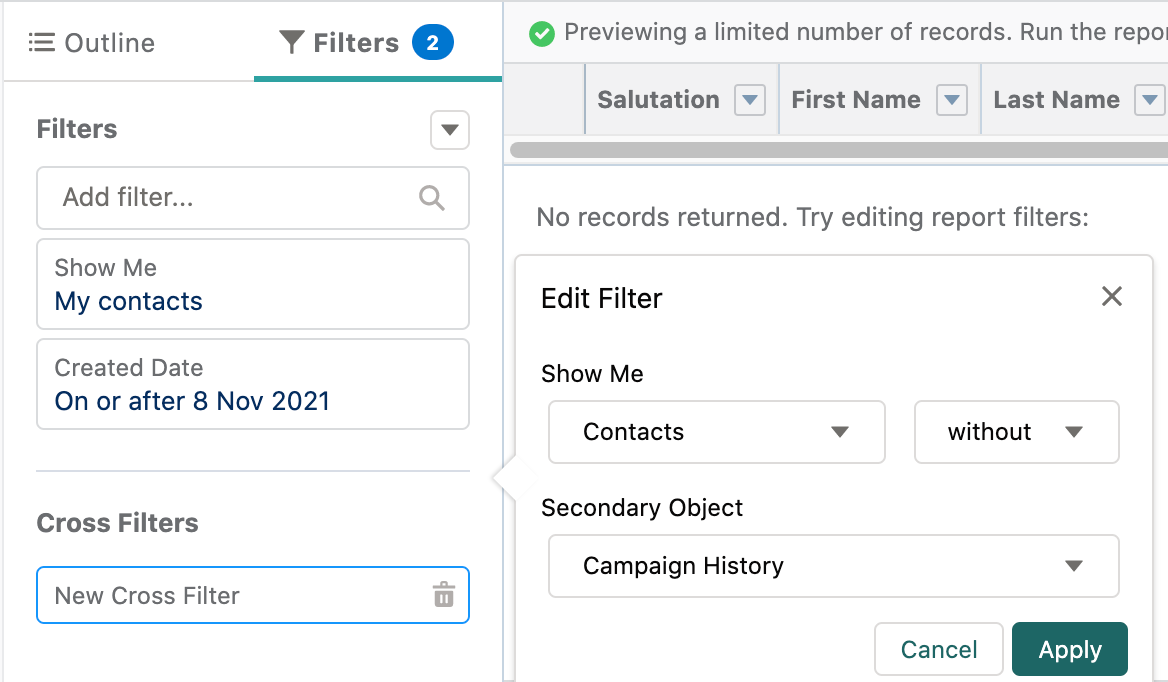
Cross Filters enable you to find where data does not exist, sometimes described as an exception report. In the Report Builder, Cross Filters are added like any other filter, with extra options. Their format is:
Show me — [primary object] — with/without — [related object]
Example: Show me — Contacts — without — Campaign History
Take Cross Filters further by adding additional filters. After selecting the objects, an additional filter box appears. This is where you add sub-filters to narrow down the related records even further:
Example: Show me — Contacts — without — Activities — with status: “open”
Will pull a report with all contacts that have no open activities.
Cross Filters are essential for Salesforce Admins to master to avoid unnecessarily creating custom report types or rollup fields.
3. Summary Formulas
Summary Formulas can handle complex calculations at all summary levels.
Summary Formulas act like fields once the formula has been created, hence why they are referred to as Summary Formula Columns in Salesforce Lightning.
At first, these can seem daunting – let’s walk through this to put this reporting feature into context.
1. Start by adding a number field to the report canvas.
2. Open up the collapsed “Fields” left sidebar. You’ll see “Summary Formulas” as a section.
Example: Say I want to find out how each account is contributing to the pipeline for each specific Opportunity “Type”. Which accounts are driving the greatest share of the new business pipeline? What about renewal opportunities?
3. Search for, and insert fields and functions to the left. I’ve used PARENTGROUPVAL in this example, which allows me to “grab” a previous grouping in the report (the total revenue for the Opportunity “Type”) and use it to calculate my percentage at the Account level.
4. Check you have selected the correct “Display” setting (you will receive an error if it’s not the correct option)
5. Once you’ve validated and applied your formula, the formula will appear as a column. Note that summary formulas appear as the furthest right column in the report (you cannot move it’s order in the report)
This is a glimpse into what Summary Formulas can do.
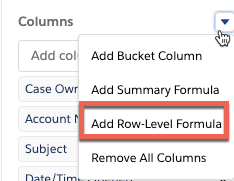
4. Row-level Formulas
From Summary Formulas to Row-level Formulas. They sound similar, but have distinct differences between them! Row-Level Formulas are applied to a single record and are displayed on the row itself.
Example: Check if two fields on the same record have the same value.
5. Reporting Snapshots
Reporting Snapshots allow you to take a picture of a set of Salesforce records and freeze the data on them for future reference. The most common use case is Opportunity Pipeline Change over time (tutorial linked below).

6. Historical Trend Reporting
While Reporting Snapshots capture a data overview at specific moments in time, Salesforce Trend reports are designed to glance back at historial field values on a given date (the “As of date”).
As this tracking is more targeted (think about how more data is captured for you to find out the value, on a specific date, on-demand!), there are limits to the objects and fields you can track with Historical Trend Reporting:
- Available for Opportunities, Cases, Forecasting Items, and up to 3 custom objects.
- Choose up to 8 fields per object.
- 5/8 Opportunity fields are pre-selected. All 8 Forecasting fields are pre-selected.
Example: show the amount value my Opportunities had in the w/c 26/07/21:
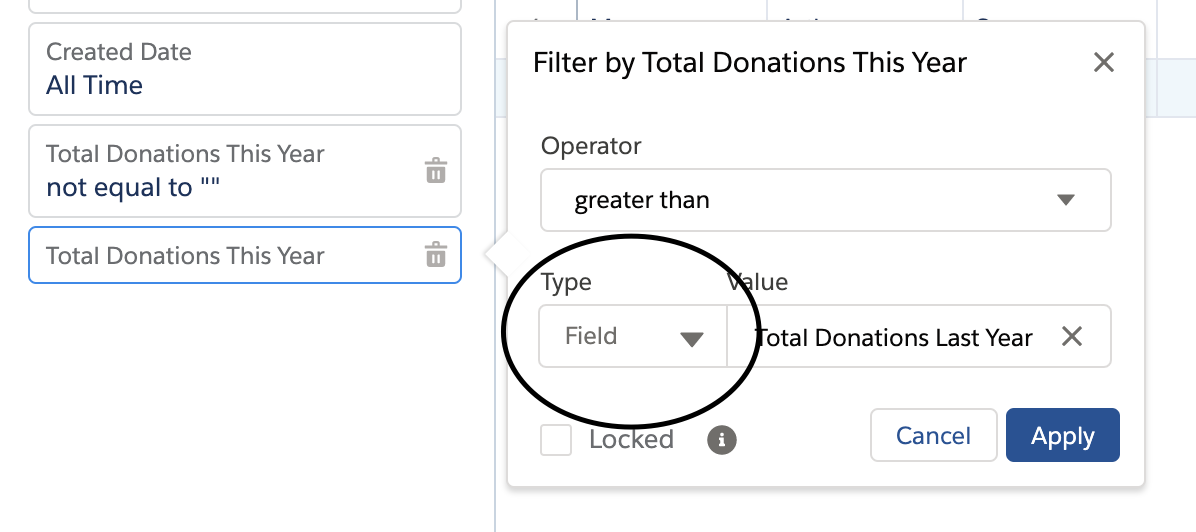
7. Field-to-field Filters
These special filters make it possible to compare values in different fields on a Salesforce report, when defining report filter criteria.
Example: filtering a report to show only Contacts with donations this year greater than last year:
8. Stacked Summaries
Stacked Summaries summarize a substantial amount of data for quicker review and comparison. This view is automatically activated when you add fields to both rows and columns, and can be switched on/off at the bottom of the Report Builder.
Example: show the number of Opportunities by account, by Opportunity Type.
Clicking on one cell of the Stacked Summaries view will filter the report that sits below.
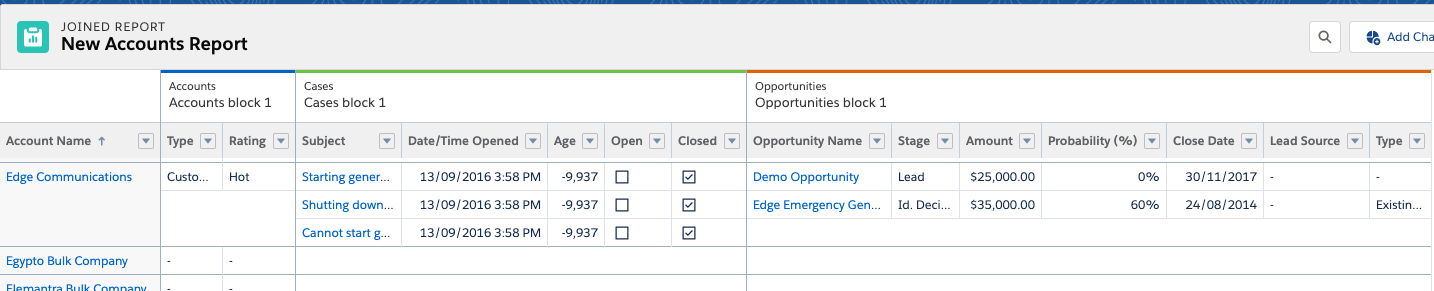
9. Joined Reports
A Joined report combines two reports that have different report types, within a single view. They appear like one single report, so that you can get a more holistic data view.
Add report “blocks”, and define the filters for each.
Example: show account details in block 1, related cases in block 2, related opportunities in block 3.
10. Report URL Hack
Not a Salesforce Reports “feature” per say but a “hack” that will certainly advance your reporting skills.
“URL hacking” parses over URL parameters to set values for filters (and fields), which is now supported in Lightning Experience. Reports URL Hacking means users can open a report with filters set by the URL parameters, removing the need to clone, replicate or have multiple reports. The URL parameters are dynamic, set automatically according to the record data the user is viewing.
Example: launch an Opportunities report from an Account record, that only shows Opportunities related to that specific Account.
Summary
Advanced reporting features in Salesforce are the tricks Salesforce power-users should know to ultimately create the reports users need – even with challenging data models – in the most efficient and scalable way (with minimal additional configuration).
Give these 10 features a test drive in your own Developer org, and let us know what you find!

Comments: